Stats Highlighting
Stats highlighting is designed to help your eyes do less work. Instead of manually comparing numbers, the scanner uses subtle visual cues to indicate when one team is clearly outperforming the other in a specific metric.
In-play statistics
Live match stats are highlighted only when both conditions are met: the value is high in absolute terms and significantly higher than the opponent’s.
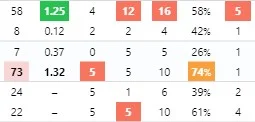
Orange highlight
- Stat value is at least 3
- At least 2.6× higher than the opponent
Red highlight
- Stat value is at least 4
- At least 3.6× higher than the opponent
Momentum
Momentum highlights indicate sustained pressure rather than single events.
Pink highlight
- Momentum score of at least 60
- At least 1.8× higher than the opponent
Expected goals (xG)
xG highlights help identify quality chances rather than volume alone.
Bold value
- xG of at least 0.8
- Higher than the opponent’s xG
Green highlight
- xG of at least 1.0
- At least 5× higher than the opponent
Pre-match averages
Pre-match averages give context before kickoff and are highlighted when one team’s long-term numbers clearly exceed the other’s.
Bold value
- Average of at least 0.8
- Higher than the opponent’s average
Green highlight
- Average of at least 1.0
- At least 5× higher than the opponent
Pre-match percentages
Green highlight
Percentage value above 70%.
Red highlight
Percentage value below 40%.