Introduction
In-Play Scanner
Strategies
Alerts
Account
Glossary
In-Play Scanner
Scanner Tooltips
Tooltips let you explore deeper match context without leaving the live scanner. By hovering over certain columns, you can instantly access extended data, visual charts, and historical context that help explain what you’re seeing on the dashboard.
How tooltips work: simply hover your cursor over a supported column.
The tooltip appears automatically and disappears when you move away.
Below is a non-exhaustive list of the most commonly used tooltips and what each one reveals.
Available tooltips
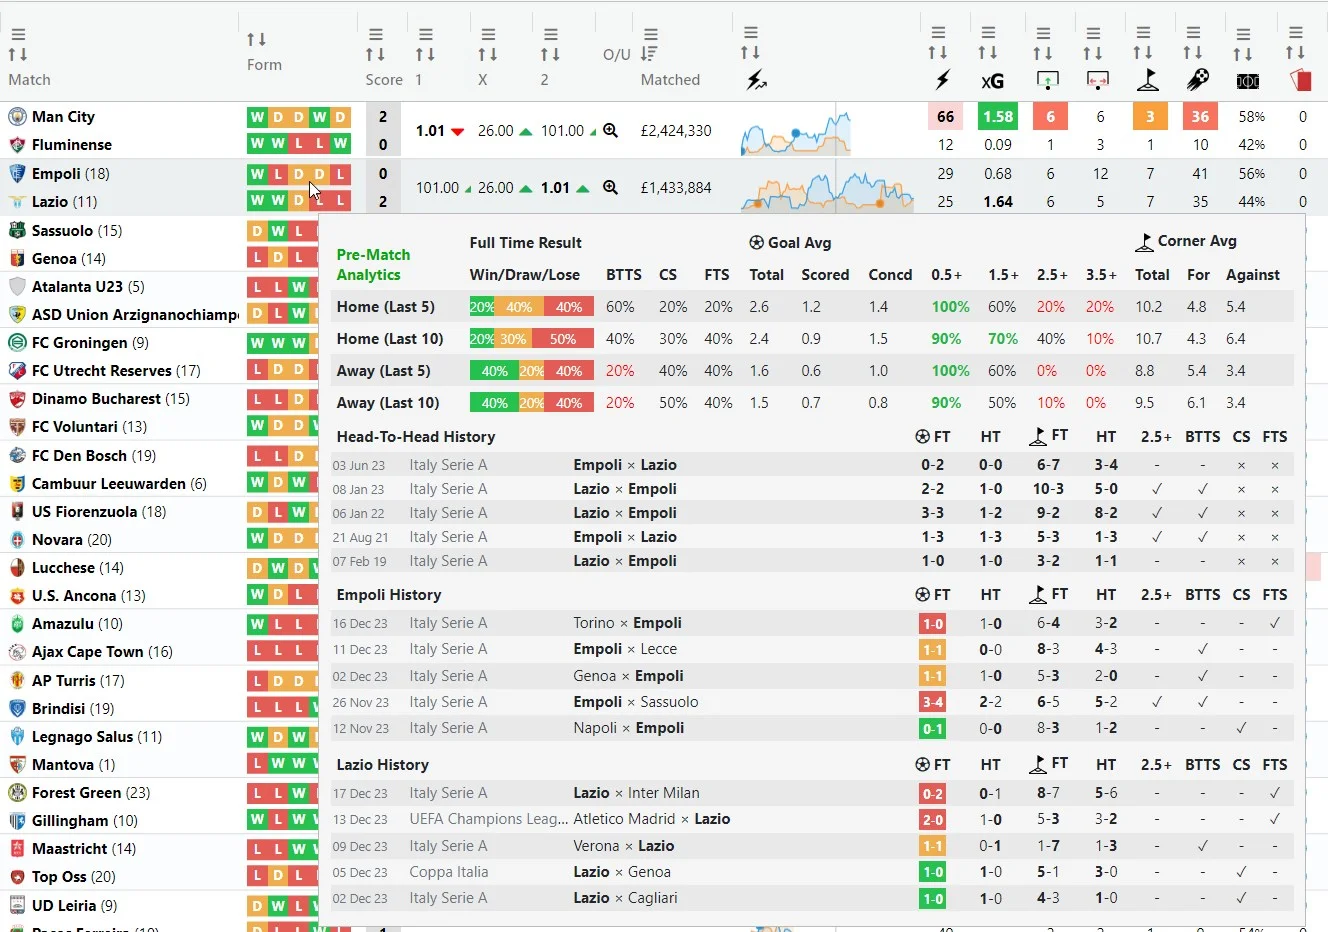
- Match
-
Displays extended match details when available, such as additional context and metadata.
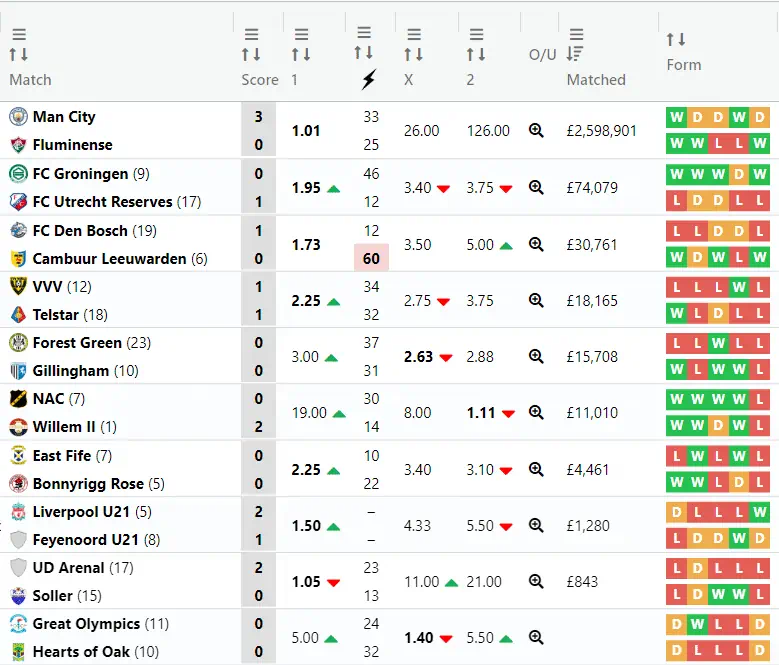
- Form
-
Shows recent team performance across the last 5 and 10 matches, independent of competition.
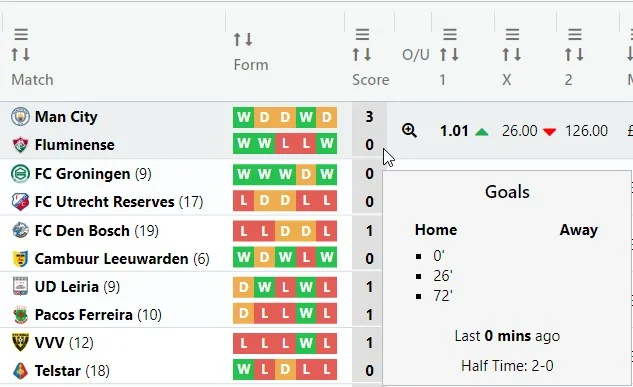
- Score
-
Reveals when goals were scored and by which team, adding timeline context to the scoreline.
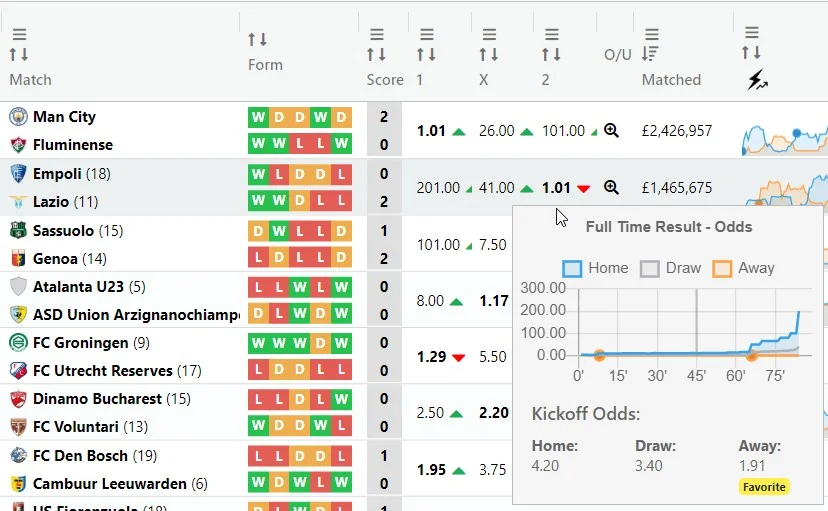
- 1 X 2
-
Displays a dynamic chart of odds movement, highlighting current values and which team is favoured.
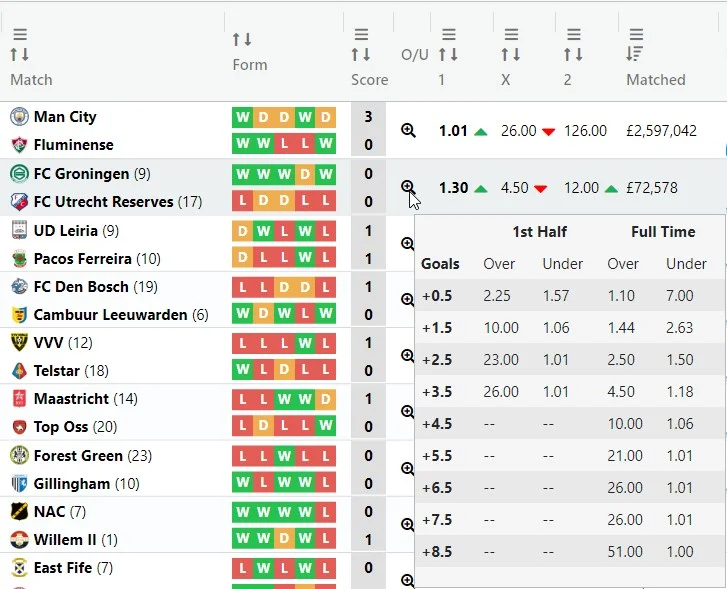
- O / U
-
Shows Over / Under total goals data for both first half and full time.
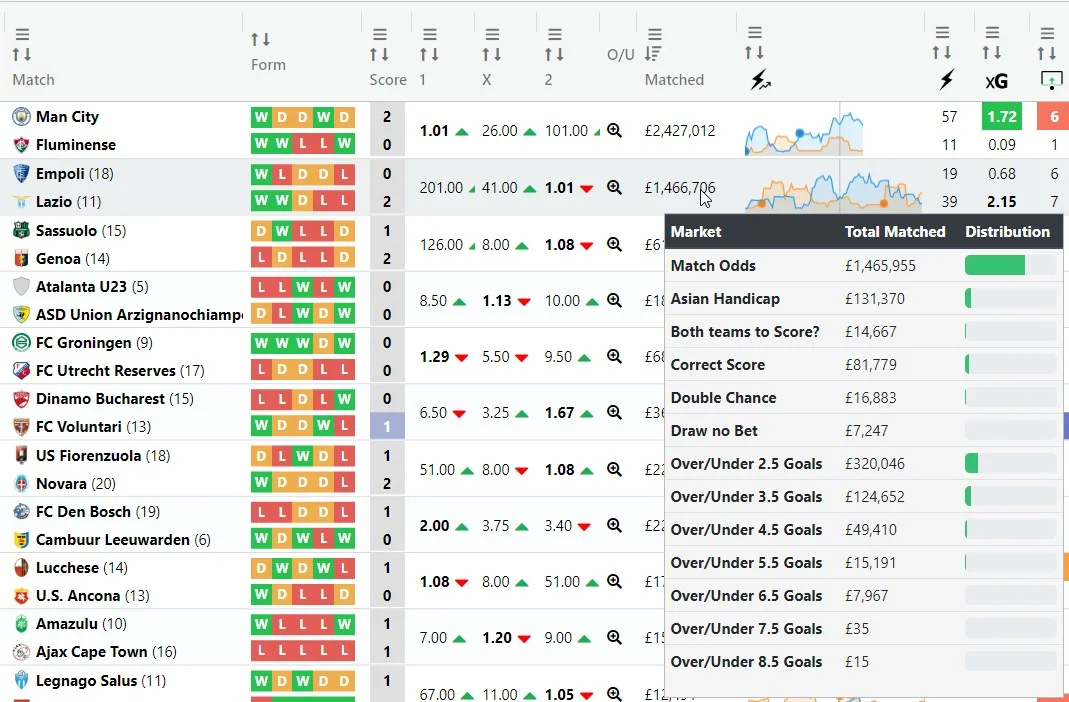
- Matched
-
Indicates how exchange volume has evolved, providing insight into market activity.
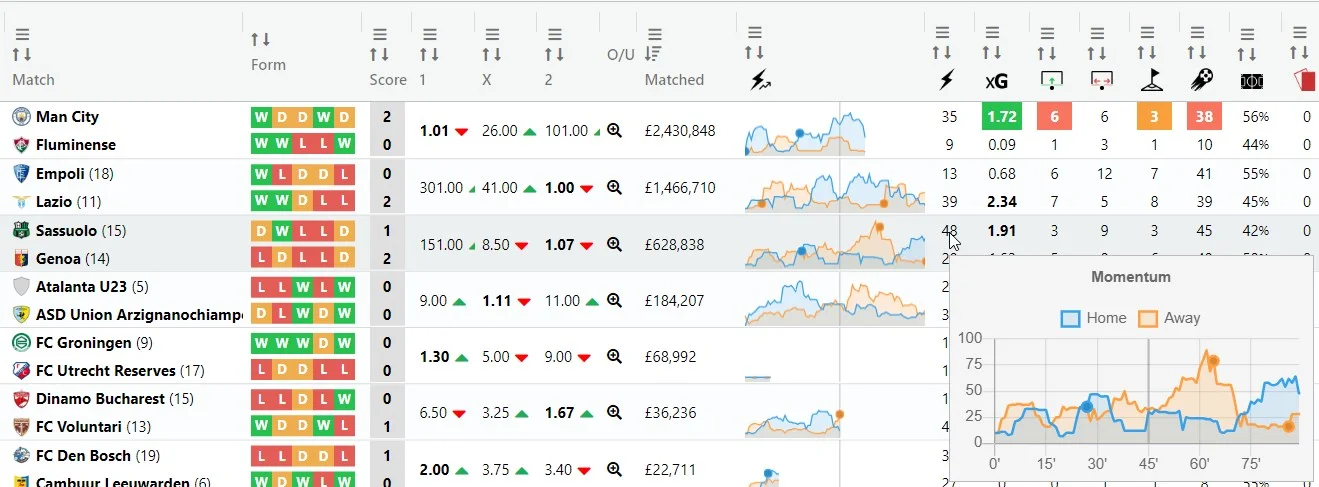
- Momentum
-
Shows a live chart of attacking pressure for both teams across the match timeline.
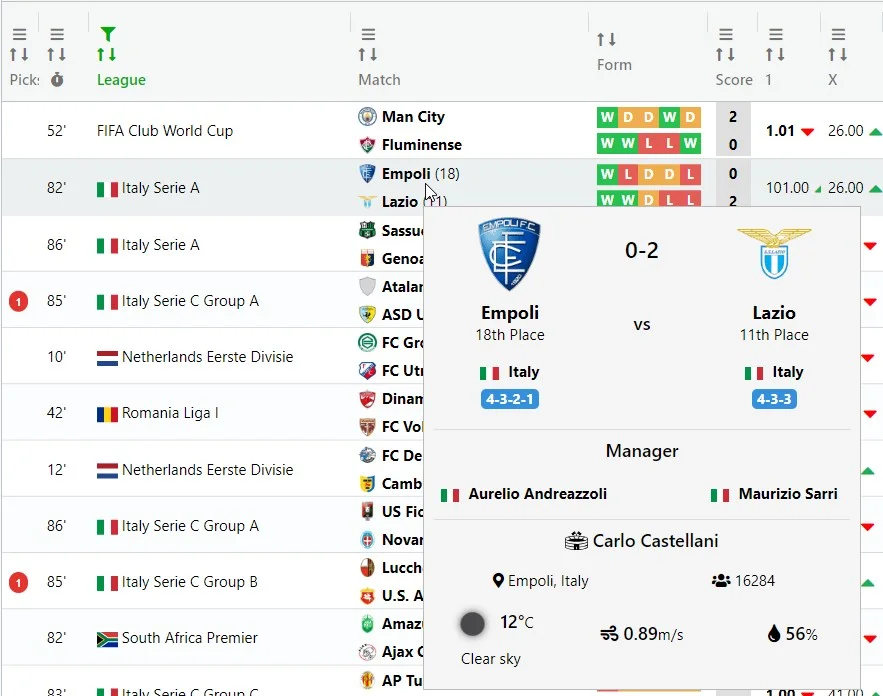
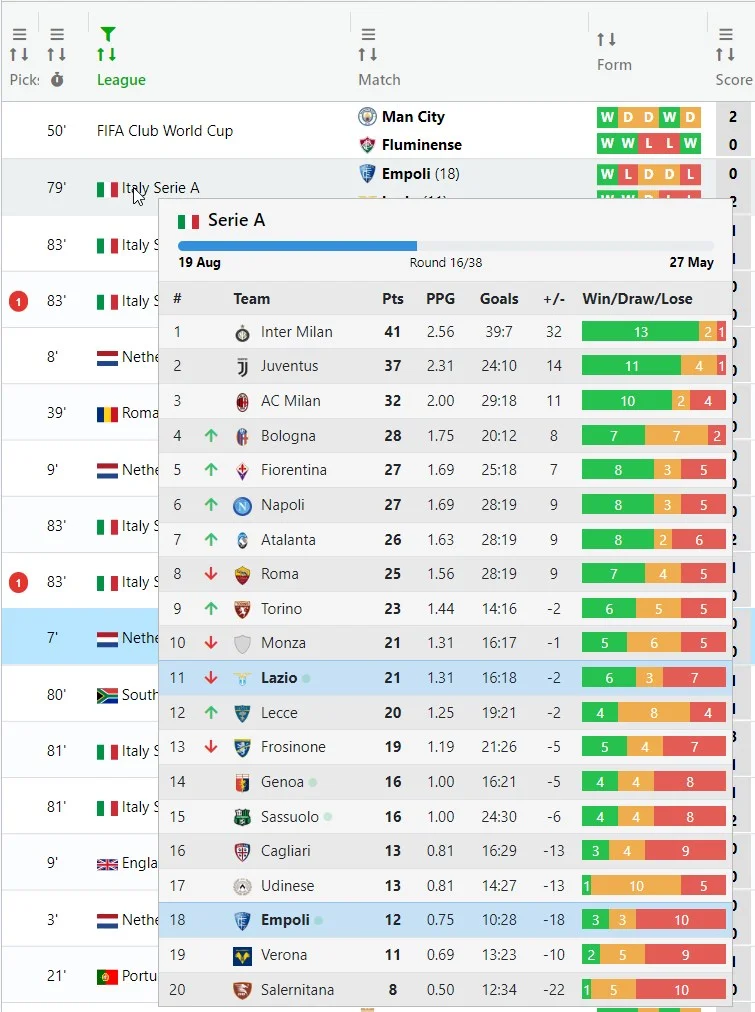
- League
-
Displays league standings, current round, points, goal statistics, and form.
Teams currently playing are highlighted for quick reference.
Tip: Tooltips are designed to reduce context switching.
Use them to confirm insights quickly instead of opening new pages or tabs.